
 1 Registry Star
Part:BBa_R0040:Experience
This experience page is provided so that any user may enter their experience using this part.
Please enter
how you used this part and how it worked out.
Applications of BBa_R0040
2023 University of Warwick iGEM (Team BioMonix)
We utilised the pTet sequence as a part of a larger construct, in the pJBEI-6410 backbone.

2017 Georgia State iGEM Team
Georgia State Growth Medium Study

Group: 2016 BIT-China iGEM team
Summary: Characterizing Part:BBa_R0040 through measuring red fluorescence intensity in E.coli TOP10 and comparing the promoter strength with mutants. The mutation is designed in -35 region of the Ptet promoter.
Documentation
Purpose: We used Ptet promoter to expression the killer gene in our project. In order to decrease the expression level of toxins, we mutated the -35 region to get Ptet promoters with lower strength. Results: Measuring the RFP intensity using enzyme labeled instrument.

Sequencing the plasmids


Methods:
Random primers are synthesized by GENEWIZ.
Template is Ptet-B0034-RFP-B0015. Designed NNNNNN in -35 region of Ptet promoter.
PCR amplification
Plasmid construction through digestion and ligation
Selection through colony PCR
Incubation for over 12 hours
Measuring the RFP intensity using enzyme labeled instrument
Sequencing the plasmids

Applications of BBa_R0040
Used this part to create constituitively on GFP and constituitively on OriTf, OriTr. This was one of our most-often used and reliable parts. Have not tried to de-activate it using TetR yet. Worked very well with our parts. [smelissali 6/7/06]
User Reviews
UNIQ481494e61af59a12-partinfo-00000001-QINU
|
•••••
Antiquity |
This review comes from the old result system and indicates that this part worked in some test. |
|
•••••
smelissali |
|
••••• |
BBa_R0040, when used to regulate transcription of GFP in BBa_I7100, demonstrated the expected behavior. BBa_R0040 also worked well in the constitutive wintergreen odor generator (BBa_J45120) and banana odor generator (BBa_J45200). |
|
••••
wmholtz |
I have used this promoter both in inducible and constitutive contexts. It generally works great, however it does contain ~20 base pairs of exactly repeated sequence. Several times I've seen recA- strains delete one of these repeated sections. |
|
•••••
Aberdeen_Scotland 2009 |
The initial gel worked although the obvious confirmation was not possible due to the very small fragment size (54bp).But later it was confirmed following its usage by forming the part BBa_K182001 through the PCR gel analysis and the sequencing.The plasmid miniprep also worked. |
|
•••••
Youri |
This promoter was used for high constitutive GFP expression and functioned properly. |
|
•••••
UNIPV-Pavia iGEM 2011 |
PTet promoter was assembled upstream of different mRFP coding sequences, containing an RBS from the Community collection. The assembled RBSs are:
For an inducible device, the RBS variation has the purpose to stretch the induction curve, thus modulating its PoPs-OUT range. The complex RBS-promoter acts as a whole regulatory element and determines the amount of translated protein. RBSs have been reported to have an un-modular behavior, since the translational efficiency is not independent on the coding sequences, but variates as an effect of different mRNA structure stability [Salis et al., Nat Biotec, 2009]. It is not possible to separate the effects of the sole promoter and of the sole RBS on the total amount/activity of gene product (in this case study, mRFP). For this reason, every combination 'Promoter+RBS' was studied as a different regulatory element. Regulatory elements were characterized using mRFP reporter protein for different RBSs in terms of Synthesis rate per Cell (Scell) and R.P.U.s (Relative Promoter Units) as explained in measurements section.
The Hill function relating the induction to the Scell is reported below: Scell=α * ( δ + (1-δ)/(1+(K/Induction)η) ) Operative parameters of the promoter are derived from the estimated Hill equations obtained by nonlinear least squares fitting (lsqnonlin Matlab routine) of the Hill function expressed in RPUs:
The protocols for the characterization of pTet promoter are reported in the pTet measurement section. The data collected from the mRFP measurement systems were processed as described in data analysis section. The induction curves were obtained by fitting a Hill function as described in modelling section and the estimated parameters for pTet are reported in the pictures and in table below. This promoter is widely studied and characterized usually using the strong RBS BBa_B0034. Here we have characterized its transcriptional strength as a function of aTc induction (ng/ml) for different RBSs. Three different induction curves were obtained and are reported in figure: 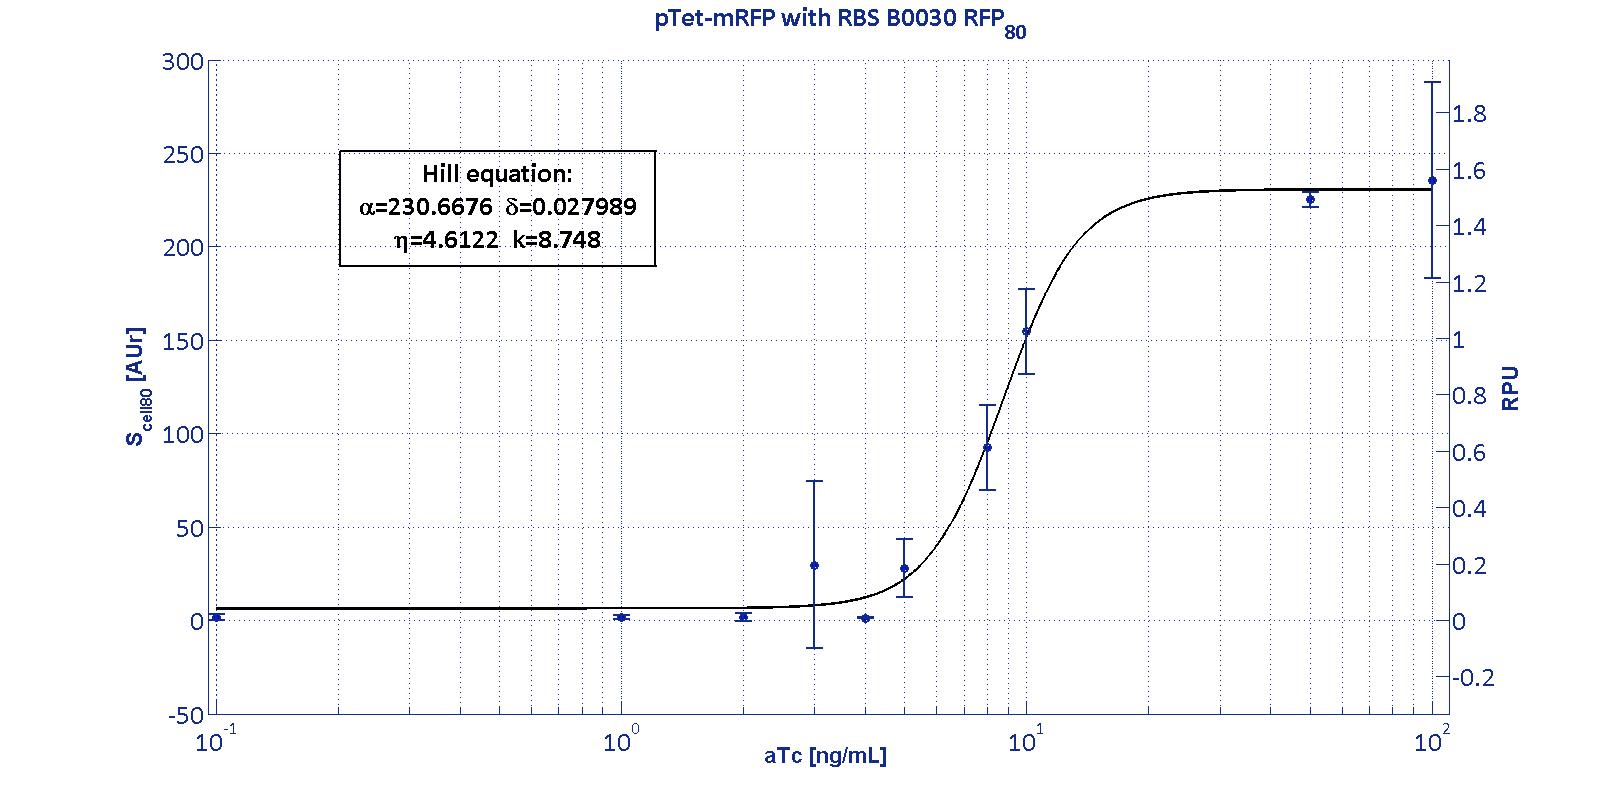
The estimated parameters of the Hill curves described in the figures are summarized in the table below:
The measurement system pTet-B0031-mRFP-TT couldn't be assayed because its fluorescence output is under the detectability threshold of our measurement instrument. For this reason, the parameters of the corresponding Hill curve couldn't be estimated and are reported as 'Not Determined' ND. α parameter (representing the maximum trascriptional rate in the studied range of induction) varies as expected with the RBS variation and also the δ and η parameters are quite different among the RBS variations. The kpTet parameter is quite constant among the RBS variations, thus suggesting that in this case the RBS variation doesn't substantially affect the switch point of the Hill curve, even if the amplitude and the maximum slope are not quite maintained (for the η parameter, maybe fitting problems). The operative parameters are summarized in the table below:
From these parameters, it is evident that whilst the switch-point is almost maintained for all the RBSs, the linear boundaries are similar for RBS30 and RBS32 but for RBS34 are moved on the right of one order of magnitude. |


|
Review must be between 0 and 5
iGEM2016_ |
The project of our team this year is to build a Tristable switch. Our design aims to achieve three main characteristics: stable and distinct signal output, and fast state-switching rate. In which stability is the major goal that we would like to achieve. As a results, the strength of the promoters need to be similar. As a result, we compared the promoter strength of phlFp, tetp and lacp by ligating them with a GFP reporter gene, BBa_E0240, in BioBrick RFC10 standard.
 Fig 2. Comparison on the strength of phlFp, tetp and lacp. Negative control represents BBa_E0240. Characterization was done using E. coli strain JW0336. Cells were first precultured overnight and were subcultured to mid-log phase where GFP emission measurements were made using an EnVision® multilabel reader. This result was obtained by combining 3 characterization data obtained in 3 different days. Error bar present SD from 3 biological replicates. |
UNIQ481494e61af59a12-partinfo-00000011-QINU
Characterization
Transcriptional control of GFP generator
We successfully designed, constructed and tested transcriptional control devices for constitutive, stationary phase dependent and exponential phase dependent protein production (A-C). To test and verify function of our three transcriptional control devices, we assembled each control device with the GFP protein generator BBa_E0840 and monitored the fluorescence of E. coli cultures with each device over time. For each device, we plot the change in fluorescence per unit time (normalized GFP synthesis rate) versus the cell density (OD600nm) (D). The constitutive transcriptional control device produced a high GFP synthesis rate irrespective of cell density. The stationary phase transcriptional control device produced a low initial GFP synthesis rate which increased with culture cell density. The exponential phase transcriptional control device produced an initially high GFP synthesis rate which dropped off as cell density increased. Data shown are averages of triplicate measurements of cultures grown from three individual colonies of each device. Error bars are the standard deviation of the three individual cultures.
Transcriptional control of banana odor enzyme generator

To demonstrate growth phase dependent banana odor production, we compared the behavior of constitutive and stationary phase dependent banana odor generators (A and B, respectively). We measured isoamyl acetate concentrations of cultures of the constitutive and stationary phase banana odor generators at different culture cell densities (OD600nm) (C). As expected, the stationary phase banana odor generator produced very little isoamyl acetate at low cell densities but its isoamyl acetate production increased with cell density. By comparison, the constitutive banana odor generator produced more isoamyl acetate at lower cell densities than the stationary phase banana odor generator. To visually aid comparison of the two odor generators, an empirical fit to the data for each device is shown.
Transcriptional control of wintergreen odor generator

To demonstrate growth phase dependent wintergreen odor production, we compared the behavior of constitutive and exponential phase dependent wintergreen odor generators (A and B, respectively). We measured methyl salicylate concentration (relative to the pentachloronitrobenzene internal standard) of cultures of the constitutive and exponential phase wintergreen odor generators at different culture cell densities (OD600nm) (C). The constitutive and exponential phase wintergreen odor generators produced similar levels of methyl salicylate at all cell densities examined. Thus, the exponential phase wintergreen odor generator does not work as intended.
|
[http://2013.igem.org/Team:UCSF UCSF 2013] |
|

